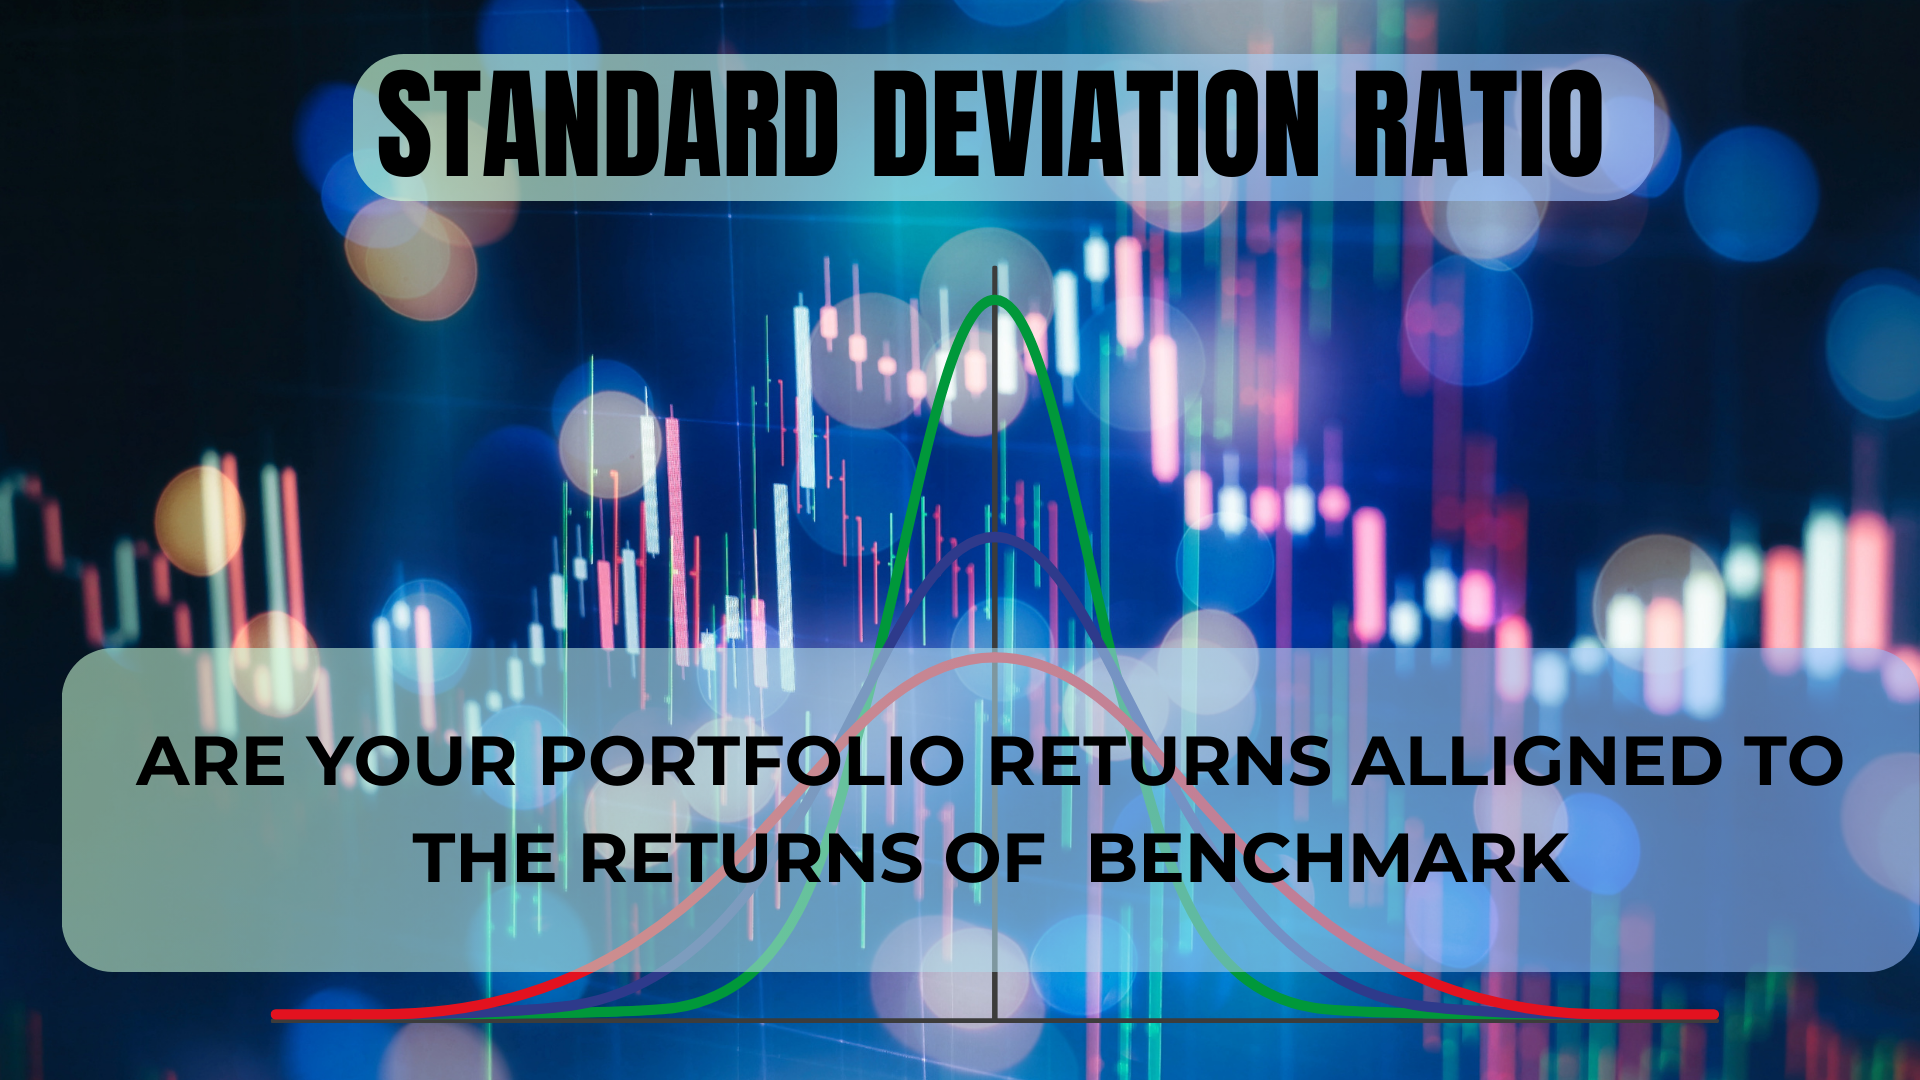
As a healthcare professional, your time is precious, and so is your financial future. When it comes to investing, returns are only part of the story. Investment experts say that returns and risk go hand in hand. So, what exactly is “risk” in investing? Simply put, it is the possibility that an investment’s actual return will differ from its expected return, and this includes the unfortunate possibility of losing some or even all your original investment.
Various factors can influence risk: changes in the economy, fluctuations in interest rates, market trends, business cycles, and even regulatory changes. That is why asset management companies publish risk measures on mutual fund factsheets to help you, the investor, make more informed decisions. But how do you understand these risk measures, and which ones should you pay attention to?
Here, I will break down the key risk metrics that can help you assess and manage risk, so you’re equipped to make smarter, more secure investment choices.
Key Risk Measures Every Investor Should Know
1. Alpha: Measuring Outperformance
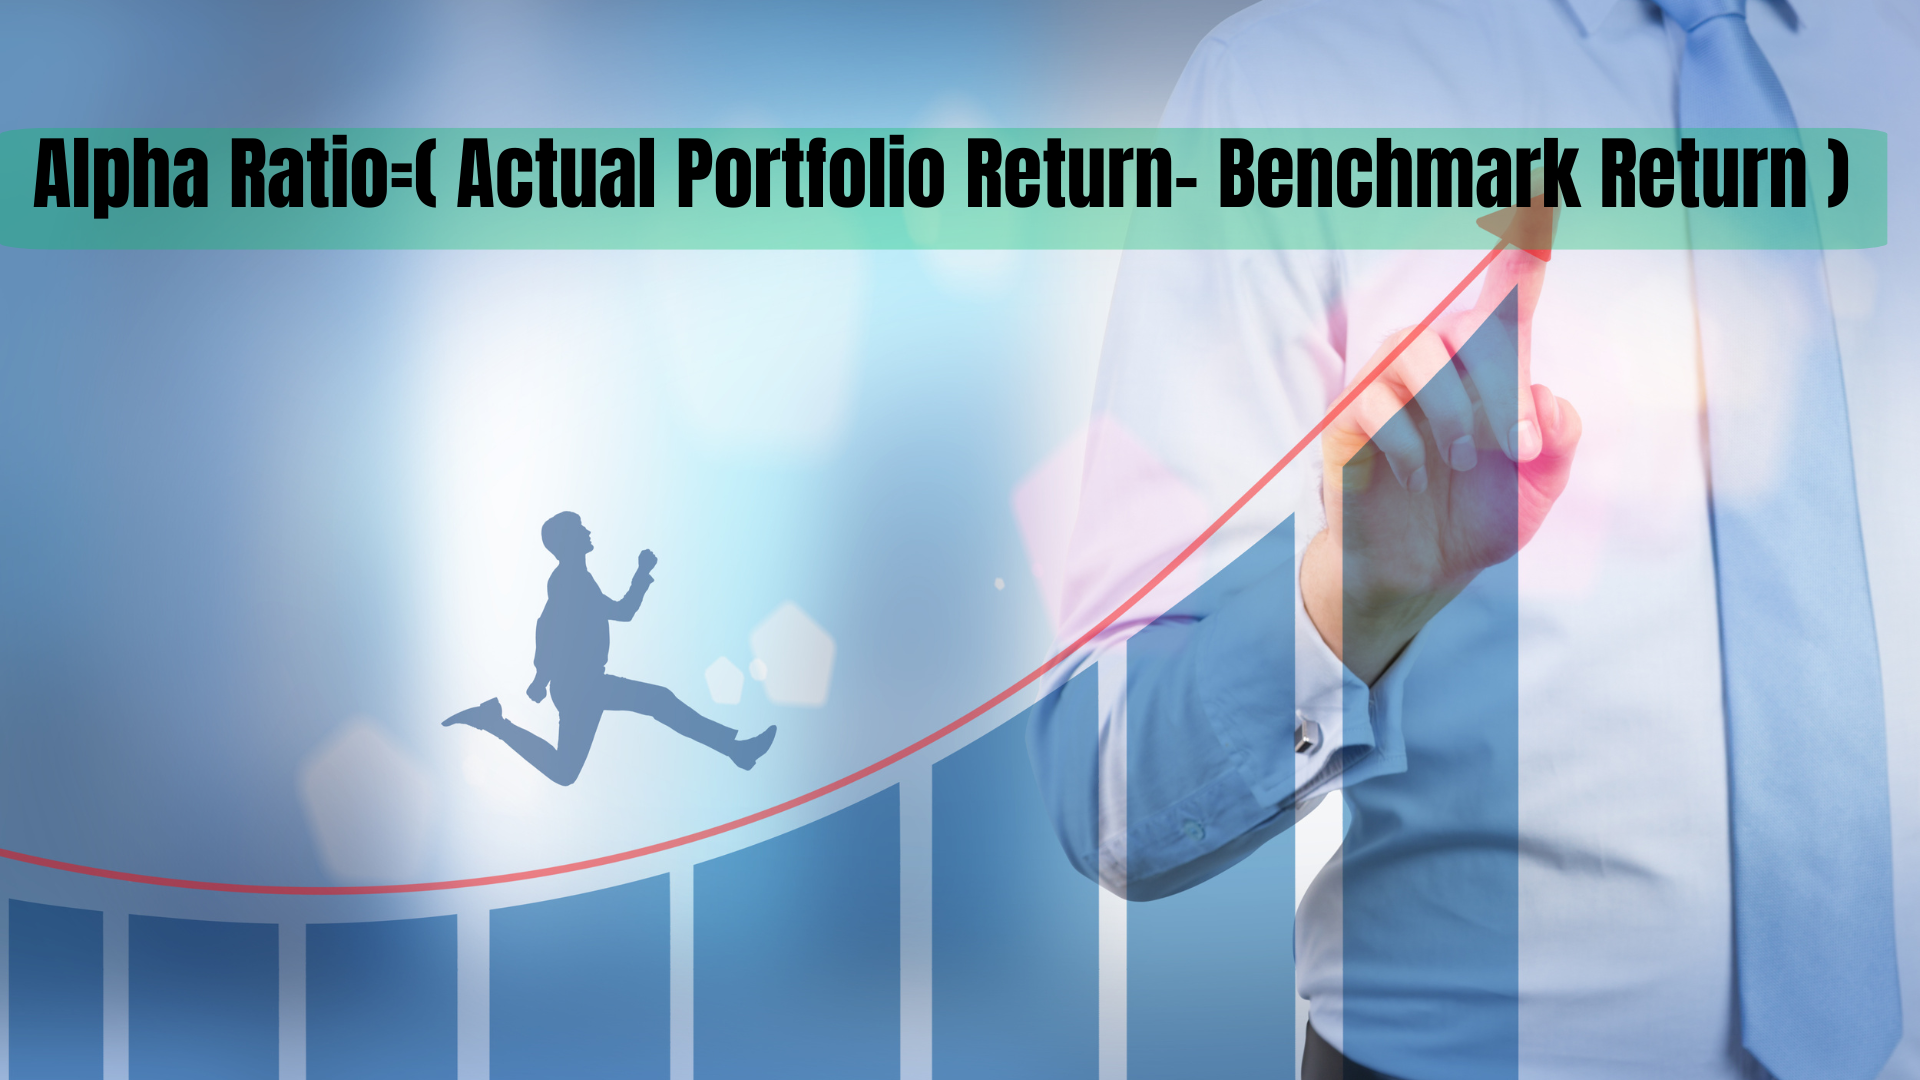
- What It Means: Alpha is a measure of how much better (or worse) an investment has performed compared to a benchmark index on a risk-adjusted basis. It reflects the “excess return” the fund manager was able to achieve above what was expected based on the market’s performance.
- Why It Matters: A positive Alpha means that the investment has outperformed the benchmark, which could indicate effective management. For example, if the benchmark index returned 8% and your mutual fund returned 10%, the Alpha is 2%, showing that the fund outperformed the benchmark by 2%.
- Takeaway: Higher Alpha values generally indicate better fund management and higher returns above market expectations.
2. Beta: Gauging Volatility
- What It Means: Beta measures a fund’s volatility relative to the overall market. A beta of 1 means the fund’s movement matches the market, while a beta over 1 means it is more volatile. Funds with a beta less than 1 are less volatile than the market.
- Why It Matters: Risk-averse investors may prefer funds with a lower beta, as these tend to have smaller fluctuations during market downturns. On the other hand, those with a higher risk tolerance might be drawn to funds with a beta above 1, which could offer higher returns during market upswings.
- Takeaway: A lower beta can mean more stability, while a higher beta can signal more potential for growth (and risk).
3. R-Squared: Understanding Correlation with the Market
- What It Means: R-squared measures how closely a fund’s performance mirrors that of its benchmark. It is measured from 1 to 100, with 100 being perfectly aligned.
- Why It Matters: Higher R-squared values suggest a strong correlation with the benchmark, while lower values imply that the fund’s performance is less tied to market movements. This metric does not measure performance but rather consistency with the benchmark.
- Takeaway: A high R-squared means you can expect your fund to behave similarly to the benchmark index, making it easier to anticipate performance.
4. Standard Deviation: Measuring Historical Volatility
- What It Means: Standard deviation shows how much an investment’s returns have deviated from its average over a given period. Higher standard deviation means more volatility, while lower standard deviation indicates a more stable investment.
- Why It Matters: An investment with high standard deviation may yield higher returns but will also come with higher risks, as its performance fluctuates widely. In contrast, lower standard deviation implies steadier returns, which many investors find more predictable.
- Takeaway: Investments with lower standard deviation are generally more predictable, which can be appealing for those looking for stable growth.
5. Sharpe Ratio: Balancing Risk and Reward
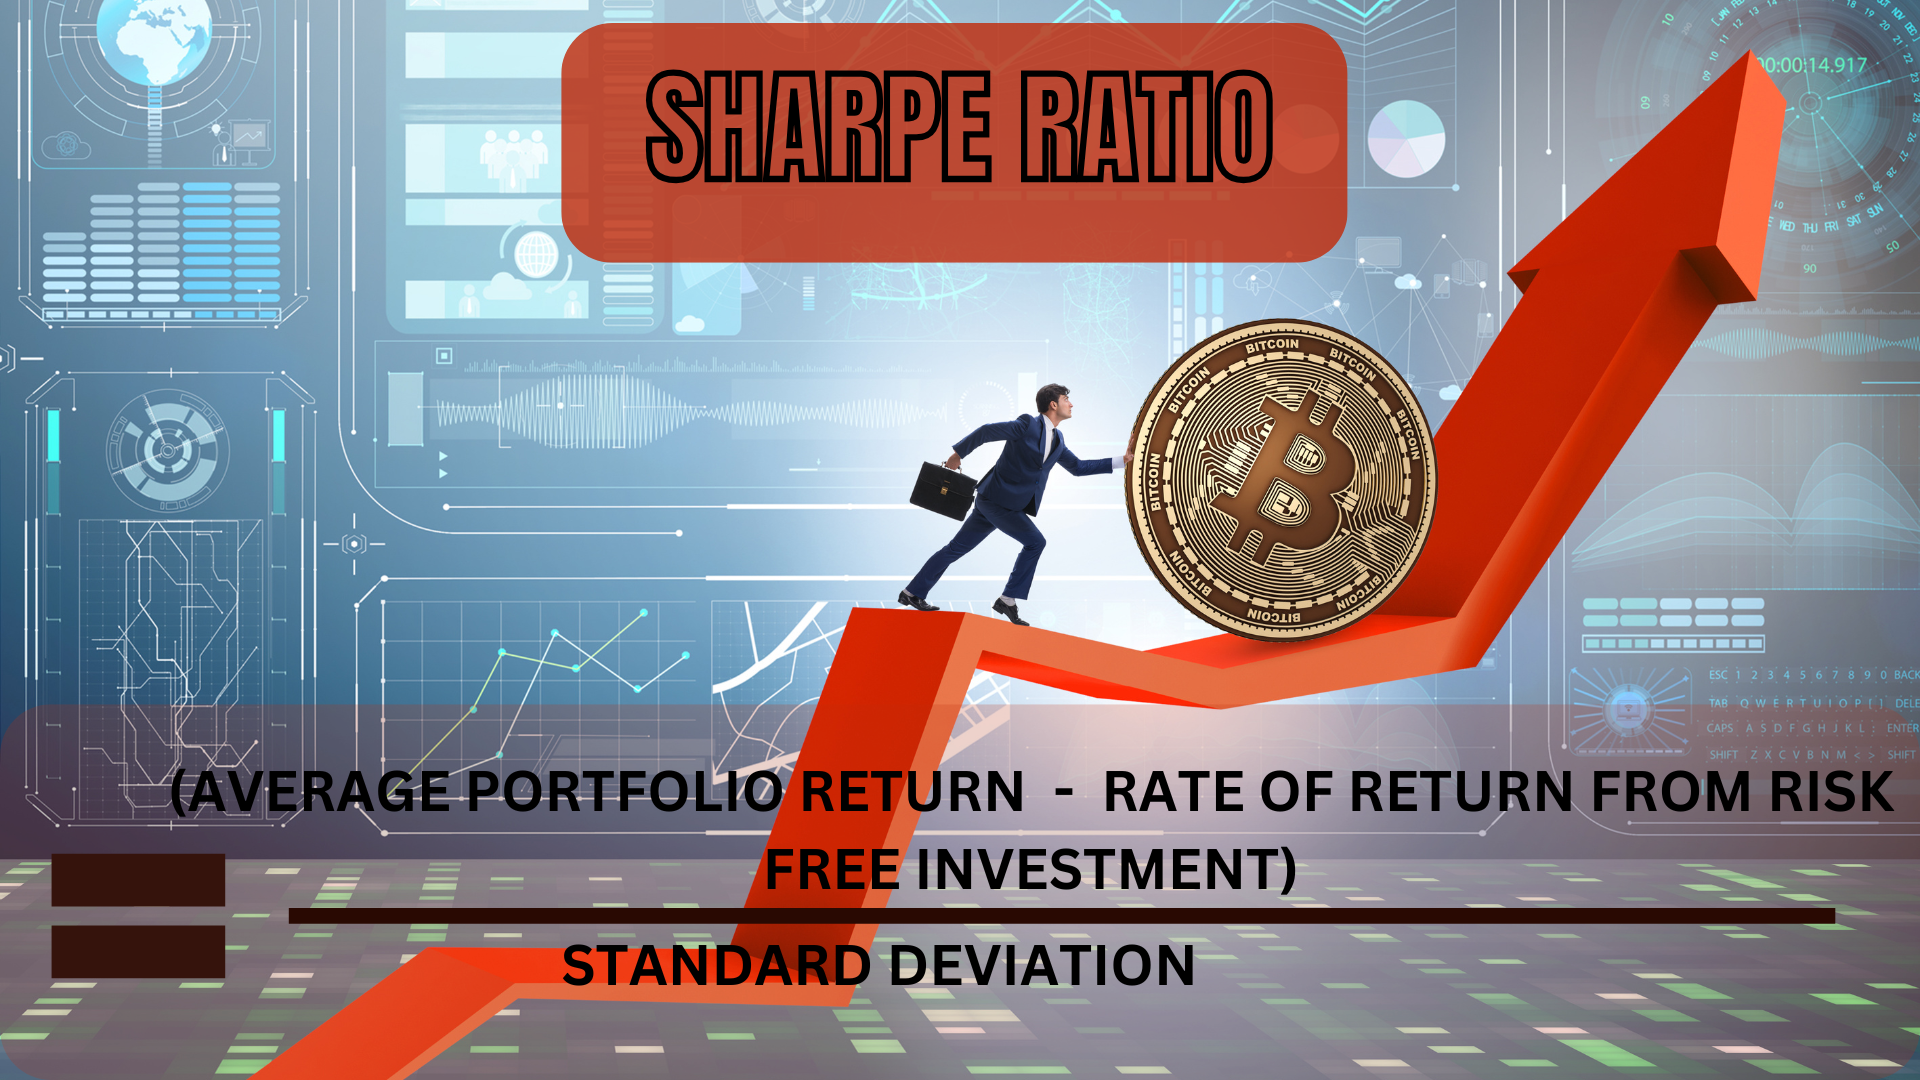
- What It Means: The Sharpe ratio measures how well a fund compensates you for the risk taken. It does this by calculating the excess return over a risk-free rate, such as a government bond, per unit of risk.
- Why It Matters: A higher Sharpe ratio means better risk-adjusted returns, making it an especially valuable metric for high-risk investments. This ratio can help you assess if the returns are worth the level of risk you’re taking.
- Takeaway: Higher Sharpe ratios indicate better returns relative to risk, making them helpful when assessing the value of riskier investments.
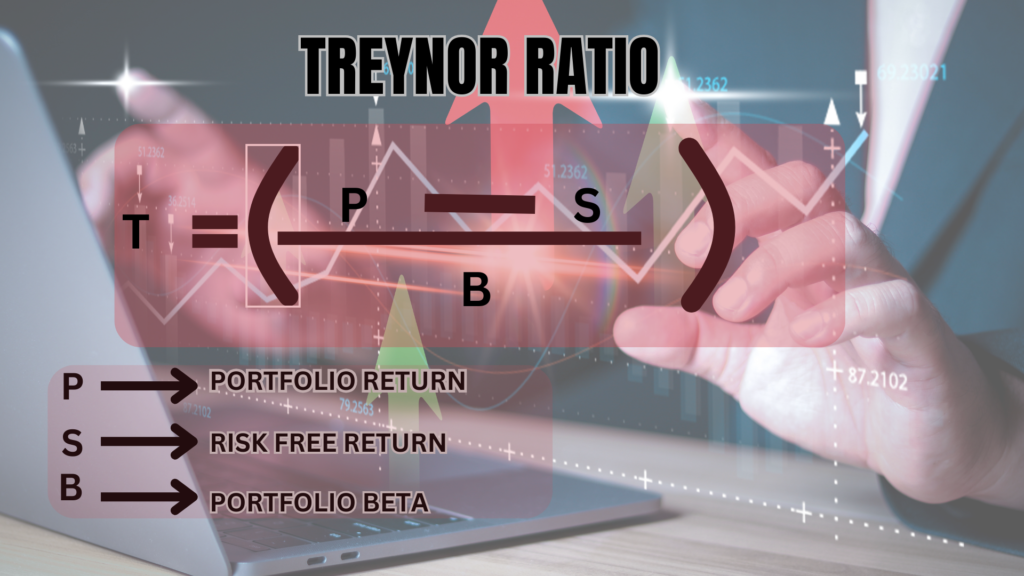
6. Treynor Ratio: Efficiency Per Unit of Market Risk
- What It Means: Similar to the Sharpe ratio, the Treynor ratio measures returns above a risk-free rate, but it uses Beta as the risk metric rather than standard deviation. It’s particularly useful for assessing funds within the same asset class.
- Why It Matters: A high Treynor ratio indicates that a fund is generating strong returns relative to its market risk. This ratio is helpful for comparing investments within similar categories.
- Takeaway: High Treynor ratios show a fund’s efficiency in handling market volatility, which can be valuable if you’re looking at investments in riskier markets.
7. Expense Ratio: Understanding the Cost of Investment
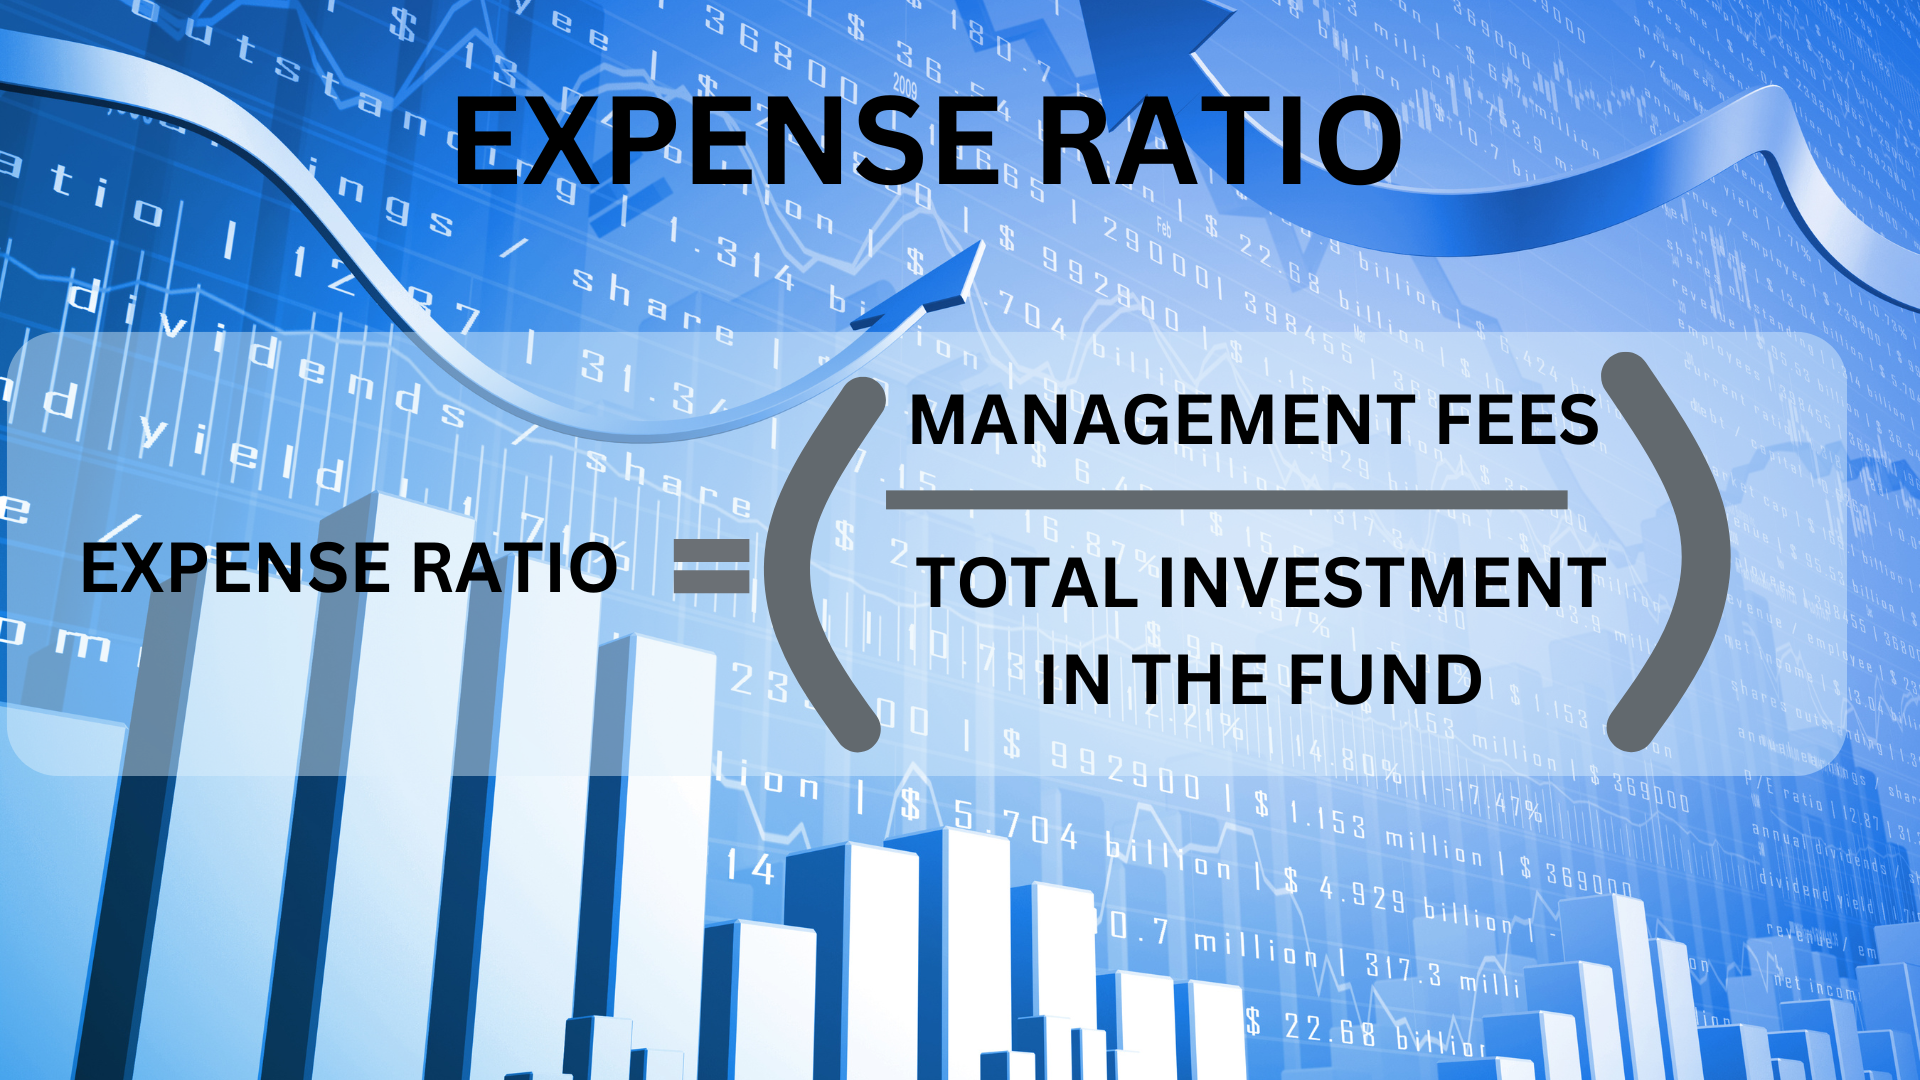
- What It Means: The expense ratio is the annual fee a mutual fund charges its investors to cover operating expenses. It’s represented as a percentage of the fund’s assets under management (AUM).
- Why It Matters: The expense ratio directly affects your returns, as it’s deducted from the fund’s earnings before returns are distributed. Higher expense ratios mean more of your potential returns go toward covering the fund’s costs, which can have a significant impact over time.
- Takeaway: A lower expense ratio is generally more favorable, as it means more of your money is invested for growth rather than covering fund expenses. When choosing between similar funds, consider the expense ratio to help optimize your investment’s cost-efficiency.
Key Takeaways
A higher Alpha, Sharpe Ratio, and Treynor Ratio are positive indicators of performance, while a lower Beta and Standard Deviation suggest lower volatility. A higher R-Squared shows better alignment with the benchmark, making returns more predictable. Additionally, a lower Expense Ratio is preferable, as it preserves more of your returns. Together, these risk measures provide a comprehensive view of a fund’s volatility, historical performance, cost-effectiveness, and the “value-added” by the fund manager.
Final Thoughts
When evaluating a mutual fund, do not focus solely on returns. Understanding these risk metrics can help you see the bigger picture and make more informed decisions. Each risk measure offers insights into volatility, returns, cost, and alignment with the market, all of which can help you make better investment choices.
Ready to take control of your financial future? With the right knowledge and guidance, you can make investments that align with both your professional and personal goals. Contact us today to discuss how we can help tailor a plan that prioritizes your financial security and fits your lifestyle.
Get in Touch
Feel free to reach out to us through any of the following methods:
